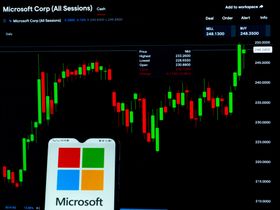
Which time chart is best for finding stocks to trade?
Asked 4 years ago
I usually use the daily chart and the weekly chart to find the stocks I want to trade. I look at the daily first, and if I like it, I will try and confirm with the weekly. I have a friend who looks at the weekly chart first for a trading strategy, but I feel like he misses a lot of entries. Which chart would you look at first, and how do you find your trades?
Avik Das
Thursday, September 09, 2021
In all honesty, it would totally depend on your investment strategy. If you are investing with a long-term plan then it doesn't make sense to check the daily chart first and hence, weekly chart would be more suitable. People who are more technical look for daily charts. Therefore, I would suggest looking at the weekly chart first.
Andrew Moran
Friday, September 10, 2021
It depends on what type of investor you are and what your trading strategy is in this market.
If you are an active daily trader, a tick chart is a good tool to incorporate into your daily or weekly investing endeavors. This produces a new bar every time a set amount of transactions are completed.
Moreover, when it comes to time charts, a 10- or 15-minute chart time frame is right for someone who wants to see the major trends and movements throughout the trading session.
For long-term investors, there are two types of technical charts to use to find stocks to trade:
- Performance versus the S&P 500
- Long-term revenue growth
These will give you an idea of how strong a company's balance sheet is and how the stock has performed compared to the broader market.
Please follow our Community Guidelines
Related Articles

How to Identify a Good Investment Company
Sofia Thai
April 23, 2021

Long Term Microsoft Stock Investment: The Pros and Cons
Andrew Moran
December 23, 2024

Saxo Bank Review: What to Consider Before Trading
Brokereviews
March 11, 2025
Related Posts
Andrew Moran
What Does VWAP Mean?
Andrew Moran
What Is the VWAP Indicator?
Andrew Moran
What are ETFs and How Do They Work?
Filip Dimkovski
How to Determine When to Buy and Sell Dogecoin
Andrew Moran
How to Calculate the VWAP
Andrew Moran
How to Trade Using the VWAP
Can't find what you're looking for?
