Best Indicators for Forex Day Trading
Updated December 23, 2024

In this brief article, we will be talking about the most profitable and accurate indicators for day trading Forex so that the life of every day trader could be made a little easier.
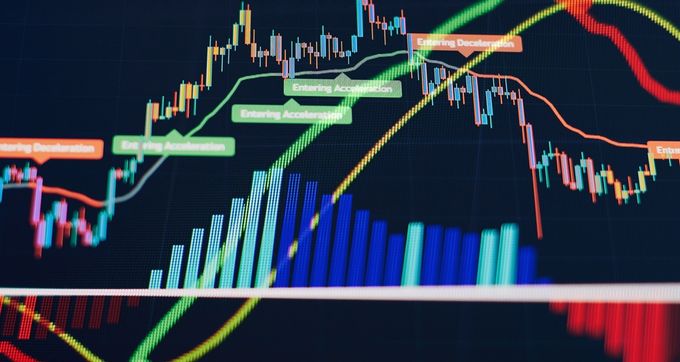
A forex indicator is a technical indicator (i.e., measure) that helps the trade examine the market's data. Forex indicators take many things into account, including currency price, volume, and market performance.
With the help of the indicators mentioned in this article, you can make better predictions about the behavior of the market in the future. This is exactly why they're a hot topic among traders, as they're set-in-stone algorithms, many of which have stood the test of time for decades on end. Thousands of day trading strategies have been built on these indicators, and many of them have been successful.
So, at this point, it must be quite clear to you what signal and forecast indicators are and why they are important for day trading. Now, with that behind us, let's take a look at the best indicators for Forex day trading.
The Top Indicators Used in Day Trading
When looking at the best indicators, it is important to understand their workings and how exactly they will impact your trading decisions. Let's look at the three best forex MT4 indicators with a brief explanation of how they work and what they indicate.
1. Uptrend/Downtrend
By looking at this trend, you can get an idea about the market's current momentum. Namely, analyzing all the historical highs and lows can be quite a valuable piece of data for your day trading choices. Although the market incentive isn't always right, more often than not, it's worth paying attention to. Most experts regard it as being the simplest—yet the most accurate—forex indicator.
Relative Strength Index (RSI)
If you've dabbled in forex trading in the past, you've probably already heard of RSI—an oscillator that indicates whether the market is overbought or oversold. With most assets, you can tell that a market is overbought when the RSI value goes over 70. On the other hand, when a market is oversold, the RSI value will drop below 30.
Namely, the RSI indicator alone may not prove to be the most important one for day trading, as it can be easily influenced by sharp and sudden price changes, causing it to give false signals on rare occasions.
However, an experienced trader will be able to look at the RSI index in combination with other important signals and principles, like the 25k day trading rule, and effectively set themselves up for a successful run in the forex market.
Exponential Moving Average (EMA)
The EMA can be quite a beneficial day trading indicator and is primarily used in conjunction with the RSI. Using these two chart indicators together often makes for an accurate reading of the market, making day trading forex successfully a much easier feat.
Regarding the latter, the EMA works by weighting prices and then giving a reading to gauge the market situation. Much like the RSI, the EMA index can be influenced by sudden changes in market prices to give out an inaccurate reading. Still, when used in conjunction with the RSI by a relatively experienced trader, it can prove to be an excellent tool for forex day trading.


